This guide is designed to help you make the most of the GIS cloud and utilise all its features.
If you run into any difficulty get in touch here
If you need help setting up your cloud account, please see the quickstart guide
Dashboard
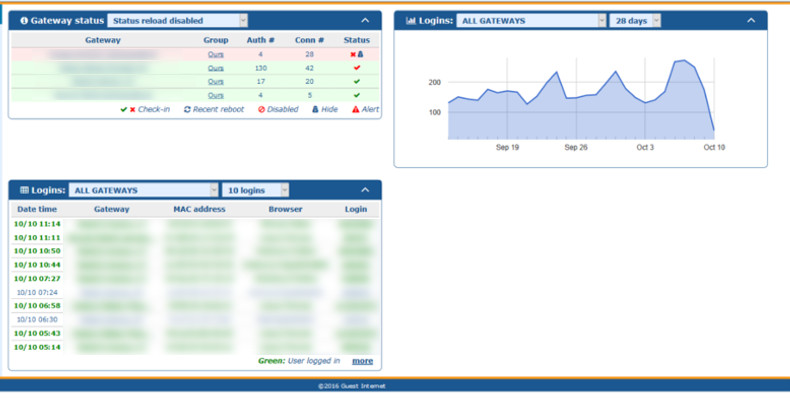
This page shows basic information for all your units
Here you will find all you need to know at-a-glance to help you check for any problems with your network.
- • The Status box shows a list of your registered GIS units, their status and the group they are in (if any). Note: When red, this shows the unit has failed to check-in or is offline; these units will always be shown at the top of the table.
- • The Logins graph plots the numbers of logins.
- • The Logins table shows detailed information about the most recent logins.
Clicking on a Gateway's name will take you the the Gateway page for this unit.
Gateways
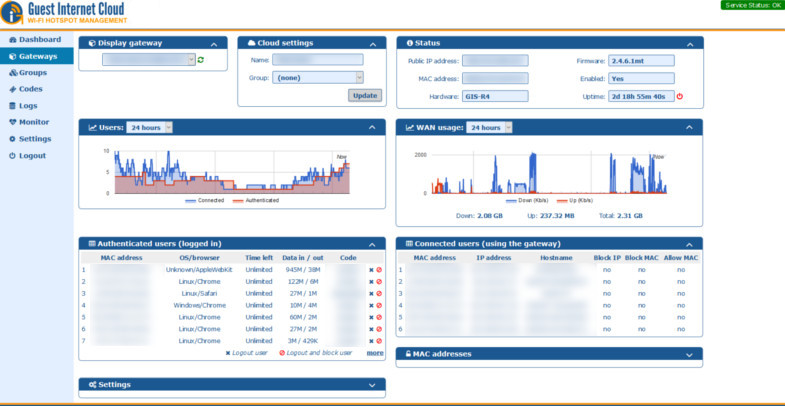
This page gives detailed information about one of your GIS units, and allows you to manage your gateways
When you first open this page you will see very little information. You first need to select one of your registered units from the dropdown menu (you will have at least 1).

Once selected you will be able to view the gateway's Status, graphs showing the Connected Users and WAN usage, list of Authenticated users and list of Connected users.
You can also modify basic settings on this page and set allowed/blocked MAC addresses.

Cloud Settings
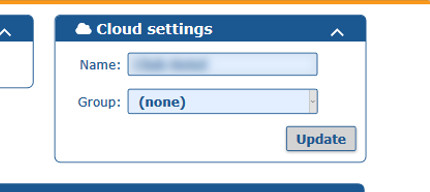
Allows you to change the name of your gateway and add your gateway into a group.
Status
Shows information about your GIS unit itself (MAC address, current firmware etc)
It also shows the unit's uptime and whether it is currently enabled.
If you have remote access enabled, you will be able to access the unit here using the spanner icon.

WAN usage
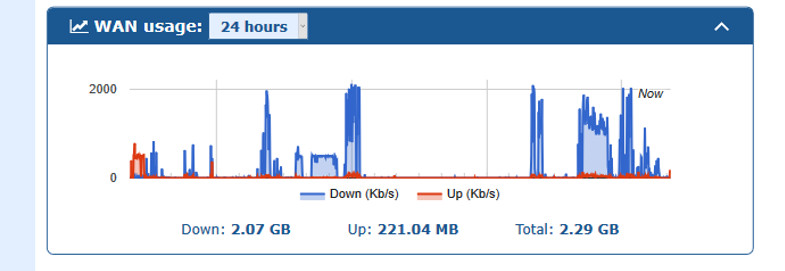
Shows the Kbps up and down on your unit over time. The timeframe can be altered to show more or less information, and hovering over the graph will give you absolute values.
Connected/Authenticated Users
Users Graph
The Users graph shows the connected and authenticated users over time.

Connected
Connected users: Users who have connected to the gateway, but not logged in
The Connected users table shows the MAC addresses, hostnames and assigned IP addresses of connected users.

Authenticated
Authenticated users: Users who have logged in to the gateway and have access to the Internet.
The Authenticated users table shows the MAC addresses, browser, time left, data up/down and code used to log in for each authenticated user. Here you can ban a user or log a user out.

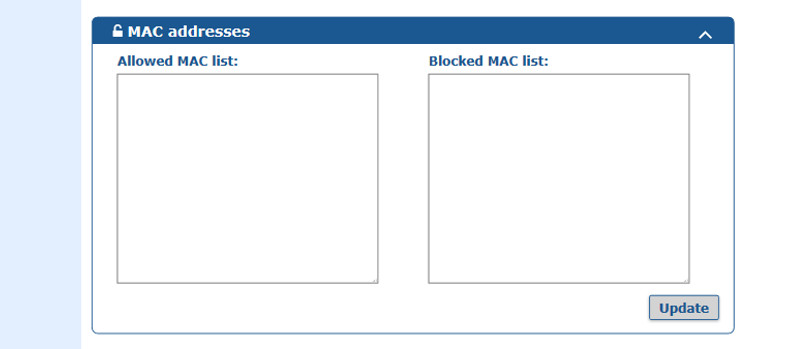
Allowed/Blocked MAC
This shows the current Allowed MAC and Blocked MAC addresses.
Allowed MACs allow a device to bypass the login page and have full Internet access at all times.
Blocked MACs will prevent this device from logging in altogether.
You can update this table and click the "update" button to edit this.
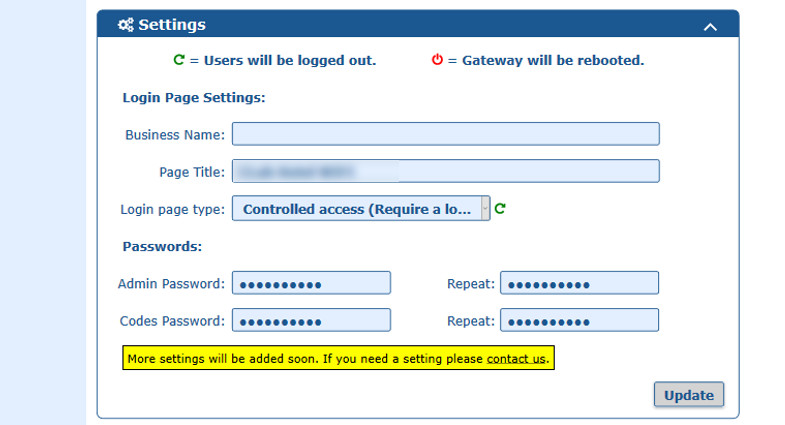
Settings
Here you can edit basic settings on your unit. More settings will be added as the cloud is developed.
Contact us if you need another setting adding.
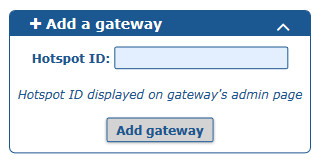
Adding another GIS unit
When you set up your account, the GIS unit you signed up with is automatically added to your account. If you wish to add further units to your account, simply enter the ID of the unit into the "Add a Gateway" box, then click "Add gateway".
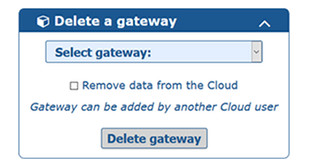
Removing GIS unit from the Cloud
If you wish to remove a GIS unit from your Cloud account, on the Gateway page, under "Delete a Gateway", simply select the ID of the unit you wish to remove, and click "Delete Gateway"
Groups
Create code groups (sharing codes across multiple GIS units)
With groups you can create codes to be used across multiple GIS units. Groups also allow for easier management and monitoring of multiple units.
To use groups you must first create a group using a unique group name.
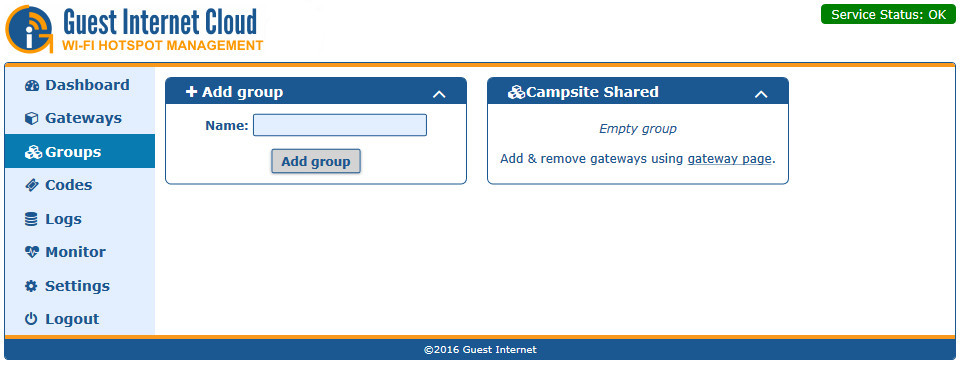
Once created you can add gateways to the group by selecting the group in the Cloud Settings on the Gateways Page. You can now create group codes which will be shared across any GIS unit in the group. These are created on the Codes page
Codes
Create codes for single GIS units or groups
You can create codes as usual for a single unit using the same method as on your local GIS admin interface.
- • Code Text - The name of your code ("Random" creates alphanumeic random code)
- • Number of codes to create - The number of random codes to create
- • Expiry time - The amount of time you wish to give to the user
- • Usage - Number of users for a single code (1-5 or unlimited)
- • Down speed - Max allowed Mb/s down
- • Up speed - Max allowed Mb/s up
- • Down limit - Max allowed data downloaded
- • Up limit - Max allowed data uploaded
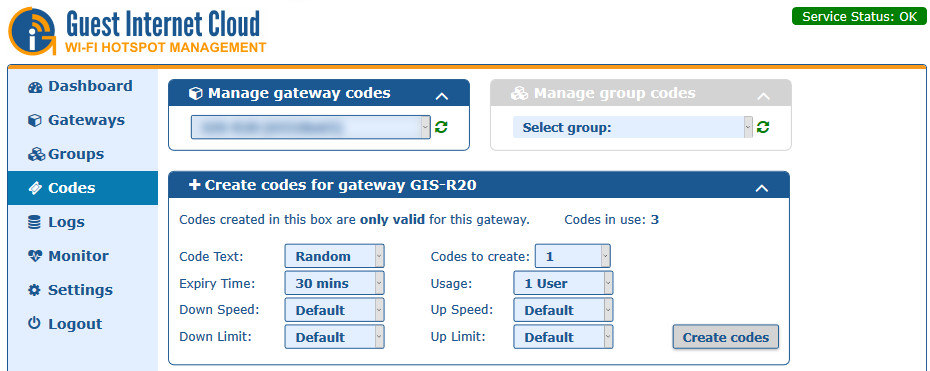
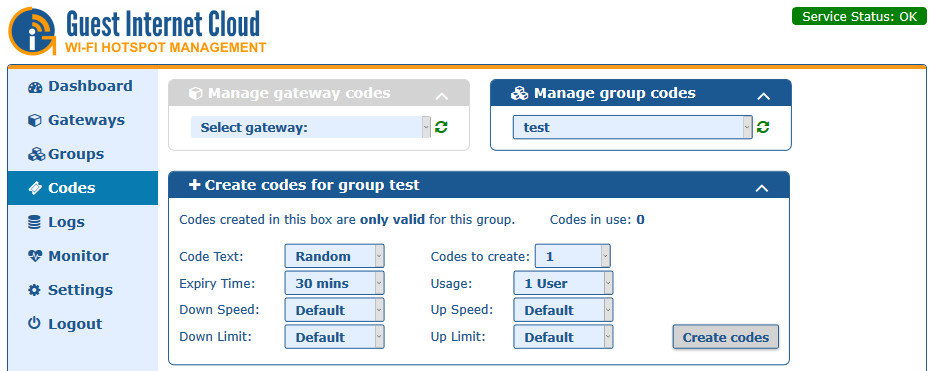
You can also select a group to create codes for. Group codes are created in the same way as individual gateway codes.
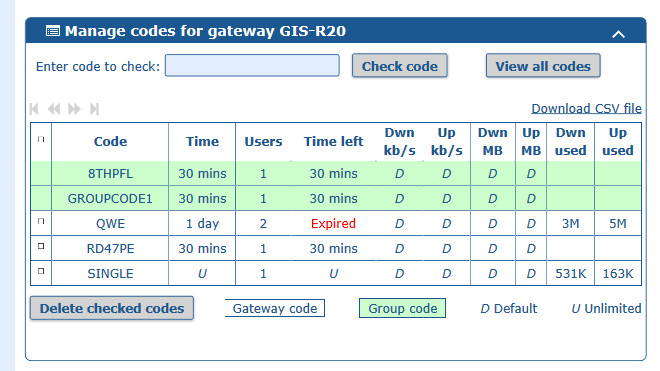
You can also view all codes on this page for the selected unit or group. Group codes will be shown highlighted in green. (this will be the same on your GIS unit's local admin interface > Manage codes page.)
Logs
View logs (usage reports)
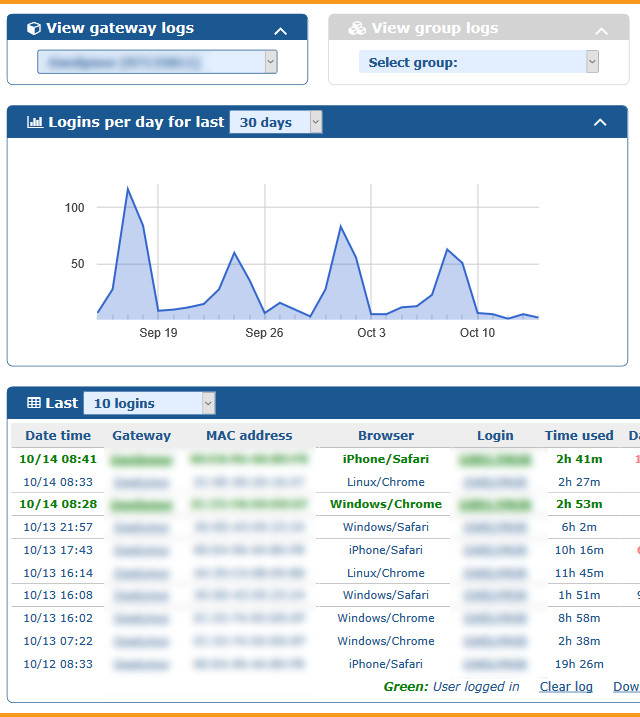
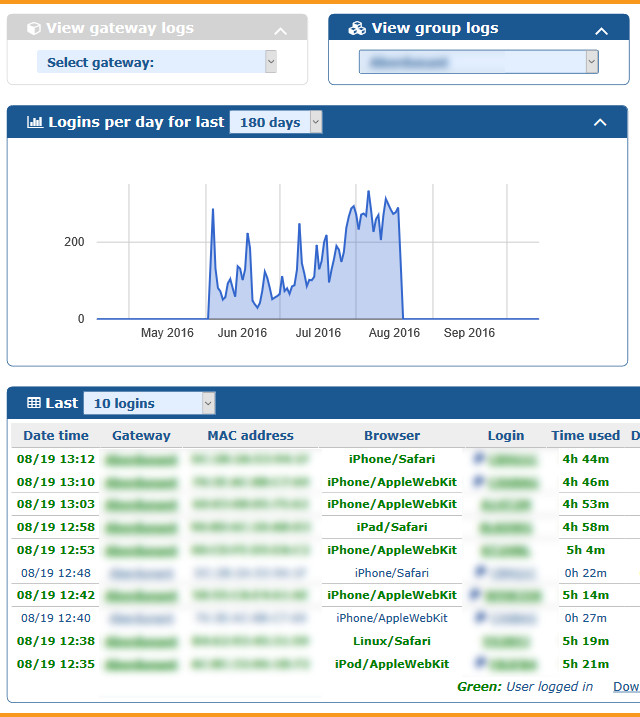
On this page you monitor usage using the graph of past usage for a single unit or a group of units.
You can also see a table of the latest connections for a single unit or group, much like the Usage reports on your GIS unit's local admin interface.
You can choose which unit you wish to show logs for
Users Graph/Table
Group Graph/Table
Monitor
Monitor Unit Status and set up Alerts
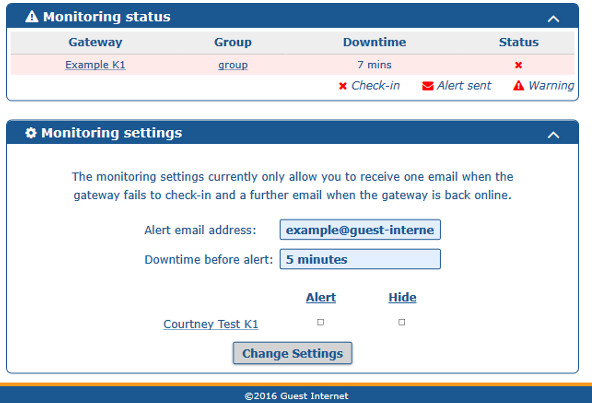
The live monitor status shows any unit which is not currently checking in with the Cloud, and shows how long it has been down for.
Tip: You can hover over the cross or tick under "Status" to see when the unit last checked in.
You can also create automatic email alerts, to let you know as soon as one of your units goes offline.
When selected, if a unit does not check-in for 5 minutes and alert email will be sent to the address you signed up with. A second email will be sent when it comes back online.
Next to each registered unit you will see a checkbox for both Alert and Hide options. When Alert is selected, an email alert will be sent if this unit goes offline. If hide is selected, this will remove it from the gateways page.
Settings
Allows you to change your password
This page allows you to change your password. Further settings may be added in future.
Failure to check-in/offline
What it means if your unit shows as offline
If your unit is showing red on the dashboard or on the monitor page it means your unit is either offline or that it has not checked in with the cloud in over 5 minutes.
If you see a red tick next to your unit, this means it has not checked in for over a minute, but below the 5 minute cut-off period to be shown as being offline. This would indicate a potential issue with the unit reporting to the cloud.
In either of the above cases, this does not necessarily mean the unit is not working; just that it has not reported to the cloud. Potential causes are that either the unit has lost access to the Internet, has an error preventing it from contacting the cloud or that it is not working altogether.
If your unit shows as being offline, you will need to investigate to find the cause. If the unit seems to be working correctly, but not reporting to the cloud, please contact us here.
Mobile
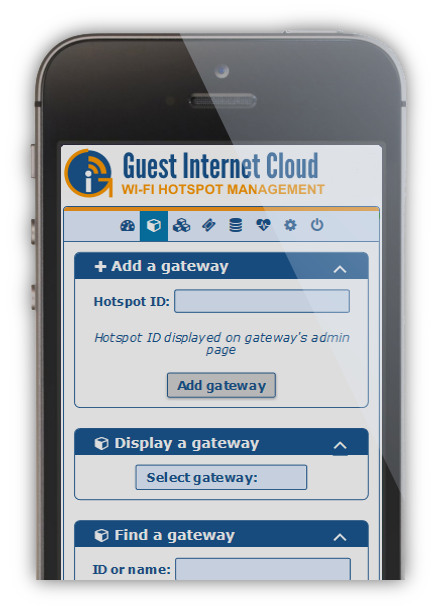
On mobiles the interface will alter slightly
On mobiles and tablets, to maximise on available space, the menu will be moved to the top and will display Icons rather than text. The icons left to right are in the same order as top to bottom on the Desktop view.
FAQ
Frequently Asked Questions
Q: How do I set up a new account?
A: See the setup guide here.
Q: How do I add another unit to my account?
A: Simply enter your units ID into the "Add a gateway" box on the Gateways page. See here.
Q: How do I create a code/group code?
A: Codes are created in the same way as on your GIS unit's local admin pages. Select the code settings and click "create codes". This can be done on the codes page. See here.
Got another question?
Let us know
